
Case Study Report: Solar PV Panel Performance and Soiling Analyses of E.W. Brown Solar Facility

Research Partnership with the PPL Corporation

PPL Corporation Team: Samuel Kelty, Brandon Jeffries, Aron Patrick

University of Kentucky Team: Chin Ng, Neng Huang, Prakhar Sharma, Otto Hoffmann, Xin Gao, Heather Nikolic, Kunlei Liu


Executive Summary

Due to a buildup of sediment, including pollen and dirt, and degradation of material, solar panel performance has degraded. Panel generation capabilities were found to decrease at an average rate of 1.04% per year due to material degradation. In addition, temperature-corrected performance ratio was found to be 6.3% below the material degradation expectation in 2022 due to soiling loss alone. If washing costs less than $0.42 per panel, the cost of washing can be recovered in a year or less due to the energy gain. Chemical analysis of the composition of the material buildup on the solar modules indicate the presence of pollen, ground soil, and potentially fly ash.


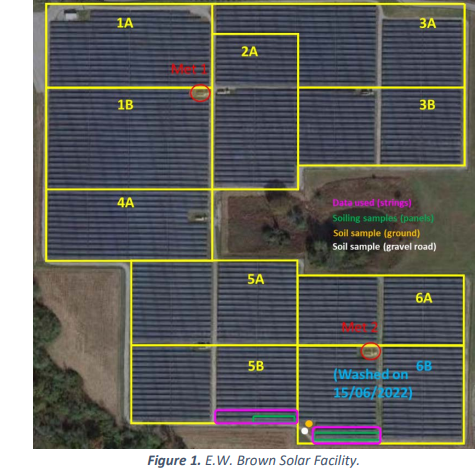
The PPL E.W. Brown Solar Facility located near Harrodsburg, KY has been in operation since September 2016. The 10-MW facility spans roughly 38.5 acres and consists of a total of 44,500 photovoltaic (PV) modules with a net generating capacity of 19,000 MWh. The modules are divided into 10 sections (1A to 6B; refer to Figure 1) and each section contains its own inverter unit.

EWB Solar Farm

This facility is situated near to the E.W. Brown coal-fired power plant and surrounded by ash ponds that were in operation during the early years of the solar farm. The ash ponds have since been decommissioned and are currently inactive. In 2021, areas near to and within the solar farm were converted to a pollinator habitat with various blooms starting around May 2021. Since April 2020, there is also a small flock of sheep grazing the field annually, starting as early as mid-March and ending as late as mid-November, depending on the weather.

Over time, soiling and volatile organic compound (VOC) materials deposited and formed a thin film cementation on the surface of the solar panels. Based on the surrounding conditions, various compounds from the power plant, dust, pollen, fibers, etc. are expected to be in the soiling materials, as well as general air impurities (sulfates, nitrates, organic carbon, elemental carbon, crustal components) found in the central KY region.

The objective of this study is to quantify the derating of solar panel performance, which results from both soiling and solar-cell material degradation. Because solar panels in Section 6B were professionally washed, using a mechanical brush and water, on June 15, 2022, the individual effects of panel soiling and material degradation that make up the total performance reduction can be decoupled via comparing the washed and unwashed panels. Consequently, performance loss associated with soiling was quantified and the benefits of cleaning were determined. To gain insight into the soiling formation mechanism, soiling materials were collected and analyzed to characterize and identify the components of the soiling materials. If the sources of the soiling materials can be traced, potential preventive measures might be designed, planned, and implemented.

Historical data, starting from September 2016, of current and power output, as well as weather conditions are available and provided by PPL. For the purpose of this study, a string (6BS1) consisting of 228 modules was selected from Section 6B (washed). For comparison purposes, a reference string (5BS6) consisting of 304 modules was selected from Section 5B (unwashed). Their locations are marked in Figure 1 and labeled “Data used (strings)”. Minute data containing current outputs from these two strings and converter power outputs from both sections, along with weather related data, collected at the two meteorological stations on site, marked as Met 1 and Met 2 in Figure 1, are used in the analyses.

Soiling samples from solar PV modules in Sections 5B and 6B as well as corresponding soil samples from two ground locations were collected; with locations shown in Figure 1 and labeled as “Soiling Samples (panels)”, “Soil sample (ground)”, and “Soil sample (gravel road)”, respectively. All samples were analyzed by scanning electron microscopy (SEM) coupled with energy dispersive spectroscopy (EDS), and X-ray diffraction (XRD).

Performance ratio is a metric commonly used to measure how effectively a plant converts sunlight collected by the solar panels into alternating current (AC) energy relative to the expected energy based on the panel nameplate rating. However, performance ratio is also affected by the solar PV cell temperature and is often corrected to the standard reporting temperature of 25 °C. Guided by Ishii et al (Prog. Photovolt: Res. Appl. 2011; 19:170–179) and the National Renewable Energy Laboratory (NREL/TP5200-57991, 2013), a temperature-adjusted performance ratio (PRadj) defined in Eq (1) below is used to study the soiling and solar cell material degradation.


PR Equation Set


In this analysis, the inverter degradation is assumed to be negligible and the total derating discussed is assumed to come solely from the solar modules. This assumption is verified by the findings shown later in this document, that the material derating of the modules is close to the manufacturer’s published rate, indicating that the inverter degradation is not a key contributor of the overall derating. Degradation rate estimations are based on inverter power outputs below 1.19 MWe, the inverter rating upper limit. Material degradation rate is calculated by comparing the performance of Section 6B solar modules after cleaning to their inaugural performance. Using the same degradation rate, the performance ratio trend for the reference section is predicted. The difference between this predicted performance ratio and the actual performance ratio of the reference section is quantified as the soiling loss.

Evidence of Derating
Total derating is defined as the combination of material degradation and derating due to soiling. Using Eq (1), the existence of total derating can be shown. Figure 2 shows that the temperature-adjusted performance ratios drop approximately 10.7% – 14.7% in the six-year duration, depending on the month from 2016 to 2022.

PR 2016 vs 2022


Effect of Cleaning on Panel Direct Current (DC) Output
Comparing current outputs of panels in Section 6B from the periods pre- and post-cleaning, as shown in Figure 3, shows that solar panel DC output increases more than 12% depending on the POA irradiance or time of the day and that the current output is almost completely recovered by cleaning the panels.

PR vs POA


Effect of Cleaning on Inverter Power Output
By comparing temperature-adjusted daily performance ratios calculated using Eq (1) for Section 6B and the reference section from May 1 to November 27, 2022, as shown in Figure 4, an increase of inverter power outputs for Section 6B after all panels in the section were cleaned (June 15) is clearly seen. The performance ratio five-day moving average for Section 6B increases from ∼75% (15 days pre-cleaning) to ∼81% (15 days post-cleaning), while performance ratio five-day moving average for the reference section changes minimally from 76% to 77% for the same period.

PR Cleaned vs Soiled


Improvement post-cleaning can also be seen via inverter maxed-out probabilities, as shown in Table 1, below. The maxed-out probability is the probability of an inverter output reaching the range of 1000 to 1100 kW and is also an indication of performance. Inverter output data from September to December of each year are used without weather related corrections in this comparison. While the reference section shows a decrease in the normalized maxed-out probability from 2021 to 2022, Section 6B shows an increase from 2021 to 2022 reflecting the improvement gain in the second half of the year (post-cleaning).

Table 1


Soiling Derating Determination

  1. Solar Cell Material Degradation
    Assuming that all performance derating related to soiling was corrected during cleaning, comparing the averaged module current outputs between new panels (September 2016) and cleaned panels after six years in operation in Section 6B, allows the effect of material degradation to be extracted 6 from the total derating of the panels. As shown in Table 2, based on averaged module current output filtered for POA irradiance of 600 to 650 W/m2 , the modules retain 93.75% of their original generation capabilities and the difference, 6.25%, is due to material degradation.

    Averaged Current
  2. Soiling Loss
    Using 93.75%, explained above, as the basis for degradation at year 6, predicted temperatureadjusted performance ratios can be calculated for the reference section. The deviation between this predicted performance and the actual performance marks the performance loss due to soiling, as shown in Figure 5 below. Soiling rate increases after 2019; from approximately 0.3% reduction in temperature-adjusted performance ratio due to soiling in 2019, to 6.3% reduction in 2022.

    Soiling Loss Identified

Financial Impacts of Cleaning
By comparing the insolation-weighted energy outputs of Section 6B from July 2022 to June 2023 to the same months in the previous year, the insolation-weighted energy gain post-cleaning can be estimated. Shown in Table 3, the performance ratio (PR) is used to estimate a more realistic insolation-weighted energy gain. By using an average monthly insolation estimated from 2017 to 2022, the monthly energy gain can be estimated accordingly. Assuming an energy cost of $0.025 per kWh, the annual gain from cleaning for Section 6B is roughly $1858.48, or an annual gain per solar PV module of $0.42. If the same gain estimation can be applied to the entire solar farm, cleaning would increase the E.W. Brown Solar Facility energy by approximately 754 MWh per year. Note that weather conditions other than POA irradiance, wind speed and ambient temperature, were not taken into account in these estimations. If a worst-case scenario is assumed, the annual gain per solar PV module and annual energy gain for the entire solar farm are conservatively around $0.34 and 609 MWh/yr, respectively.

Estimated Cleaning Gain

Soiling Material Analyses
Soiling materials from the reference section (5B) and cleaned section (6B), as well as soil samples from two ground locations, as indicated in Figure 1 were analyzed. The samples were collected from the bottom edges of the solar PV modules (labeled 5B-1 and 6B-1) and the solar PV panel surfaces (labeled 5B-2 and 6B-2). Samples from the cleaned section (6B) are newly deposited materials post-cleaning. Wind-blown dust combined with the ambient air impurities and moisture are the root cause of soiling layer formation. The ambient temperature and relative humidity likely play a role in facilitating the formation of a soiling material film. 
Results from powder X-Ray Diffraction (XRD) analysis, as shown in Figure 6 and Figure 7, show that the gravel road soil sample contains mainly calcium carbonate (CaCO3), while soiling samples from the panels in 5B (deposited from September 2016 to August 2023), panels in 6B (deposited from 16 June 2022 to August 2023), along with the ground soil sample taken are all found to contain silicon dioxide (SiO2) and aluminium oxide (Al2O3), two main components that are found in ground soil. These two compounds are also found in fly ash, a coal combustion residual. Although this solar site is located less than one mile away from the E.W. Brown coal-fired power plant, where emissions controls were installed in 2010 and two of the three coal units were retired in 2019, further research is required to definitively determine the origin of the compounds found on the solar panels, since they exist naturally in both the soil and in fly ash.

XRDXRD of Panel Soiling Materials

Results from Energy Dispersive Spectroscopy (EDS) analysis, as shown in Figure 8 and Figure 9, show that Silicon (Si) and Aluminium (Al) are the two main chemical elements found in all soiling samples. Zirconium 9 (Zr) and Molybdenum (Mo), which are used in solar cell production, as well as trace Iron (Fe) are detected in all samples as well.

Reference Material EDS6B EDS

Results from the analysis of organic carbon components by Raman spectroscopy suggest that pollen was 10 included in the deposits collected from the bottom edge of the modules and graphene structure is detected in the deposits collected from the solar cell surface, as shown in Figure 10. In 2019, the utility’s research and development team installed a 102-acre pollinator habitat at the solar farm, with 64 native wildflowers and plants, in and around the solar panels. This may be contributing to pollen buildup found on the modules.

Raman Spec

From 2016 to 2020, the pollinator habitat was mowed using traditional lawn mowers. To reduce debris, the pollinator habitat today is grazed by 50 sheep. Further research is required to determine the effect of the pollinator habitat, mowing, or grazing on soiling of solar panels. The unique environment of this solar site may not represent solar sites in different locations and situations. Further research is needed to test soiling and the effect of washing on other solar sites in other locations.


Support from PPL Corporation Research & Development is gratefully acknowledge.